Estudios
Methods and instruments to assess learning outcomes in master's degrees. Analysis of teachers’ perception of their evaluative practice
Medios e instrumentos para evaluar los resultados de aprendizaje en másteres universitarios. Análisis de la percepción del profesorado sobre su práctica evaluativa
 María Soledad Ibarra-Sáiz
Gregorio Rodríguez-Gómez
José Francisco Lukas-Mujika
Alaitz Santos-Berrondo
María Soledad Ibarra-Sáiz
Gregorio Rodríguez-Gómez
José Francisco Lukas-Mujika
Alaitz Santos-Berrondo
Methods and instruments to assess learning outcomes in master's degrees. Analysis of teachers’ perception of their evaluative practice
Educación XX1, vol. 26, no. 1, pp. 21-45, 2023
Universidad Nacional de Educación a Distancia

This work is licensed under Creative Commons Attribution-NonCommercial 4.0 International.
Received: 14 March 2022
Accepted: 13 September 2022
Published: 02 January 2023
How to reference this article: Ibarra-Sáiz, M.S., Rodríguez-Gómez, G., Lukas-Mujika, J.F., & Santos-Berrondo, A. (2023). Methods and instruments to assess learning outcomes in master’s degrees.
Analysis of teachers’ perception of their evaluative practice. Educación XX1, 26(1), 21-45. https://doi.org/10.5944/educxx1.33443
Abstract: Previous studies on the assessment methods and instruments used in higher education have revealed that the final exam has been widely used as the main source of assessment. Progress in knowledge of assessment processes has demonstrated the need for greater breadth and diversity of methods and instruments to be able to collect thorough and valid information on which to base judgements about students’ learning outcomes. Within the framework of the FLOASS Project, this study has explored the teachers’ perception of their assessment practice. Mixed methodology has been used, through an exploratory sequential design, to gather the perception of 416 teachers from six universities within different autonomous communities, who completed the RAPEVA questionnaire – Self-report from teaching staff on their practice in learning outcome assessment. The most widely used methods include participation, problem-solving tests, performance tests, digital objects or multimedia presentations and assessment instruments comprise projects and rubrics or evaluative arguments. The greatest differences depended on the university, the field of knowledge or the degree of security and satisfaction with the assessment system. Differences are small or non-existent in the case of gender or experience. Future lines of research are suggested that might improve understanding of assessment practice in higher education.
Keywords: higher education, educational assessment, student assessment, performance assessment, summative assessment.
Resumen: Estudios previos sobre los medios e instrumentos de evaluación utilizados en la educación superior han puesto de manifiesto el uso mayoritario del examen final como principal fuente de valoración. Los avances en el conocimiento de los procesos de evaluación han evidenciado la necesidad de disponer de una mayor amplitud y diversidad de medios e instrumentos que permitan recabar una información rigurosa y válida sobre la que sustentar los juicios sobre el grado de aprendizaje del estudiantado. Este estudio se ha realizado en el contexto del Proyecto FLOASS (http://floass.uca.es) con la finalidad de explorar la percepción que sobre su práctica evaluativa tiene el profesorado. Se ha utilizado una metodología mixta, mediante un diseño secuencial exploratorio, que ha permitido recabar la percepción de 416 profesores, de seis universidades de diferentes comunidades autónomas, que cumplimentaron el cuestionario RAPEVA-Autoinforme del profesorado sobre su práctica en la evaluación de los resultados de aprendizaje. Entre los medios más utilizados destaca la participación, las pruebas de resolución de problema, pruebas de desempeño, objetos digitales o presentaciones multimedia y los proyectos y las rúbricas o el argumentario evaluativo entre los instrumentos de evaluación. Se han encontrado las mayores diferencias en función de la universidad, el ámbito de conocimiento o el grado de seguridad y satisfacción con el sistema de evaluación. En el caso del género o la experiencia las diferencias son menores o inexistentes. Se aportan futuras líneas de investigación que posibiliten una mayor comprensión de la práctica evaluativa en la educación superior.
Palabras clave: educación superior, evaluación, evaluación del estudiante, evaluación formativa, evaluación sumativa.
INTRODUCTION
The methods and instruments used to assess learning among university students are a significant part of the teaching-learning process as their quality will dictate whether learning results are in line with advanced cognitive processes. When Sadler (2016) warned that we should not confuse low quality evidence of student performance with evidence of low performance, this revealed the enormous importance of assessment methods and instruments, because only when they are valid, relevant and appropriate can we make fair and well-substantiated inferences regarding the student performance.
Ibarra-Sáiz & Rodríguez-Gómez (2010) demonstrated the prevalence of the classic exam as the essential method to assess higher education. Subsequently, the study by de Rodríguez-Gómez et al. (2013) demonstrated some changes in the use of other assessment methods and instruments. More recently, Panadero et al. (2019) showed signs of a slow, progressive change in the diversity of assessment methods and instruments used in higher education, although the final exam still clearly prevails as the essential source of information to determine the final marks.
These prior studies are basically upheld based on documentary analysis of the teaching guides or programmes for the subjects, and it was necessary to go into greater depth on this aspect, working from other sources of information that provide a current, differing perspective. The study presented below specifically pinpointed the teachers’ perceptions, taken in the broader context of the FLOASS Project (Ibarra-Sáiz & Rodríguez-Gómez, 2019). This project aims to offer an action framework, upheld by the use of technologies that improve the assessment (Technology Enhanced Assessment-TEA) and learning analytics (Learning Analytics- LA), which guide the design, implementation, monitoring and assessment of the learning outcomes (Learning Outcomes-LO) that require high skill levels from students.
This study analyses the university teaching staff’s perspective, expressed via an individual self-report, within the context of master’s degrees in the social science area. This aimed to explore the assessment practice among university teaching staff, working from their own perceptions, centring their attention specifically on one of the multiple elements within this assessment practice, such as assessment methods and instruments that are used to evaluate the learning results.
It is essential to analyse the teaching staff’s perception to understand and improve assessment practice. A deeper understanding of these practices will make it possible to focus on improving the students’ learning and consequently, on aspects that facilitate change and innovation in teaching. Prior studies by Ibarra-Sáiz and Rodríguez-Gómez (2014) and Panadero et al. (2019) highlight the importance of contextual variables such as the university of origin, although other contextual variables should be analysed such as the field of knowledge, or personal variables such as gender, experience or self-perceived security and satisfaction with the assessment, which had not been previously considered.
Methods and instruments for assessment in higher education
Progress and changes have taken place in the field of educational assessment in higher education, as mentioned by Boud (2020) highlighting, firstly, that assessment policies in higher education are less based on standards and more on principles, thereby making the assessment processes more flexible. Secondly, the rise of the authentic assessment implies the use of assessment tasks and processes that represent the types of tasks and processes found in professional practice. Despite these changes, as this author mentions, “from the outside, it would be surprising to see how much practice still cannot be justified on the basis of any evaluative knowledge” (Boud, 2020, p. 8).
One example of this certain ignorance can be found when analysing the assessment methods and instruments as we are addressing a difficulty rooted in the conceptual and terminological confusion that surrounds these two evaluative concepts, which are often used as synonyms or equivalents. Consequently, Mateo Andrés & Martínez Olmo (2008) present a series of alternative assessment procedures that end up comparing performance or activities. This study works from a clear conceptual differentiation, suggested at the time by Rodríguez-Gómez & Ibarra-Sáiz (2011), who consider that “assessment methods are the proof or evidence that is used to compile information on the object to be assessed” (p. 71), in other words, the products or actions carried out by the students; and the assessment instruments are the tools that the evaluator uses to carry out systematic assessments on multiple and differing aspects or characteristics which are likely to be assessed in a product or action by the students. Consequently, a portfolio, an oral presentation, an essay or a lab report are clear examples of products or actions by students that constitute or are turned into assessment methods for anyone who has to evaluate their quality. This might be the teaching staff, classmates through peer assessment, the students themselves in a self-assessment or teachers and students jointly (joint assessment).
The systematic analysis and evaluation of these assessment methods (products and actions by the student) require instruments that help the evaluator to make value judgements. For instance, we have instruments such as checklists, which will score the presence or absence of certain features; estimation scales, assessing to what extent these evaluation characteristics appear; rubrics, used to assess different levels of achievement more descriptively and exhaustively or the evaluative argument which involves qualitative assessments.
Changes in direction in educational assessment highlighted by Boud (2020) bring modifications to the assessment methods that have gone from use of classic tests or final exams focussed on reproducing knowledge, to a set of assessment methods (portfolio, simulations, case solving, etc.) which aim to integrate and give coherence to the intended learning (Ibarra-Sáiz & Rodríguez-Gómez, 2020). As already mentioned by Dochy (2009) these assessment methods focus on the student’s performance, what they produce and do, what they are capable of doing and producing, using critical thinking and creativity in problem solving and that they are up to date.
The constructive alignment of the curriculum (Biggs, 2015; Biggs & Tang, 2011) aims to ensure that the assessment process is useful, that what is taught is relevant and targets the learning outcomes. From this consideration and based on the skill concept put forward by the European Centre for Development of Vocational Training (CEDEFOP, 2014), expressed as a person’s capacity to put learning results appropriately into practice in a specific context (education, work or personal or professional development), the assessment of the students’ skills development requires the availability of proof and evidence concerning the extent to which the chosen learning outcomes have been achieved (Brown & Pickford, 2013). This requires assessment methods and instruments that clearly demonstrate the cognitive complexity, that are comparable, that favour assessment procedure transparency and that are useful for student learning ( Dochy, 2009 ).
OBJECTIVES AND RESEARCH QUESTIONS
This paper aimed to explore the evaluative practice of university teachers working from their own perceptions, looking specifically at the assessment methods and instruments used to evaluate the learning outcomes. The research questions used as a guide were:
- Which assessment methods and instruments do teachers usually use in their evaluative practice?
- Is there a difference in the use of assessment methods and instruments that can be associated with characteristics such as the university of origin, the field of knowledge, gender, years of experience or self-perceived security and satisfaction
- In comparison with previous studies, can any changes be seen in the methods and instruments that are used for assessment in the university context?
METHOD
Research design
To carry out this study, a mixed methodology was chosen that is specified in the design that Creswell (2015) describes as exploratory-sequential, with emphasis on the quantitative phase (qual->QUAN) (Figure 1). The first phase of the research involved designing and validating the content of the RAPEVA questionnaire- Self- report from teaching staff on their practice in learning outcome assessment. The second phase includes a survey process to collect perceptions from university teachers in different Spanish regions. The data was collected during the second half of the 2020/2021 academic year.
The RAPEVA self-report
Construction of the RAPEVA self-report began with a literature review, followed by a validation process using judges (Figure 1). 22 judges took part and were asked to assess each item according to congruency (the statement really measures the dimension in which it has been classified) the clarity (it is well written and understandable) and the relevance (if it is important to measure the dimension in which it has been included). The group consensus method was chosen from the different content validation methods (Johnson & Morgan, 2016), thereby avoiding voting systems. To do this, various meetings were held with the experts until the aforementioned consensus could be reached, which was not difficult given the high score that most items received in the three aforementioned indicators. The definition and specification of the various indicators were reviewed at the end of each cycle.
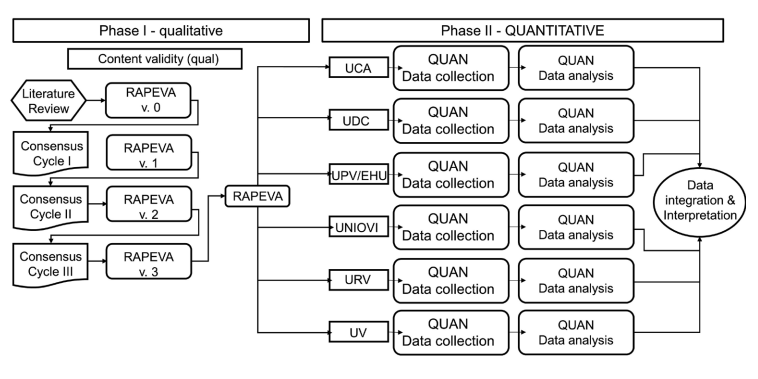
Figure 1
Exploratory-sequential design
The RAPEVA self-report is based on modelling constructs as compounds, namely as linear combinations of the observed variables (Henseler, 2021), as the cognitive and behavioural aspects play a vital role in the score that the teacher gives each item, thereby constituting a formative index (Hair et al, 2022). Consequently, it was decided to carry out a generalised analysis of structural components ( Hwang & Takane, 2015), by obtaining adjustment measurements (GFI=.89 and SRMR=.08) considered acceptable.
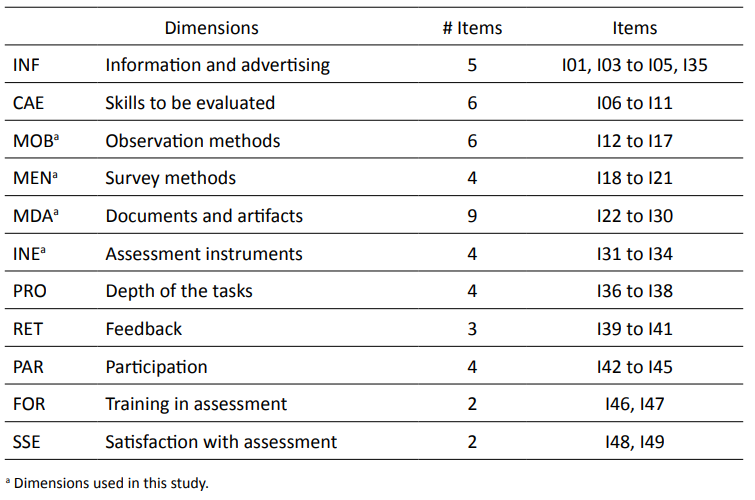
Information was initially requested on contextual aspects such as the university of origin, the field of knowledge, years of experience or gender. Secondly, 49 items were presented in a Likert type scale format (0-5) structured in ten dimensions ( Table 1). It took 20 minutes to fill in the self-report.
This study uniquely focuses on the four dimensions related to the assessment methods and instruments (MOB, MEN, MDA and INE), leaving the references to the assessment tasks for their presentation and dissemination in a different study.
Structure of the RAPEVA self-report
Participants
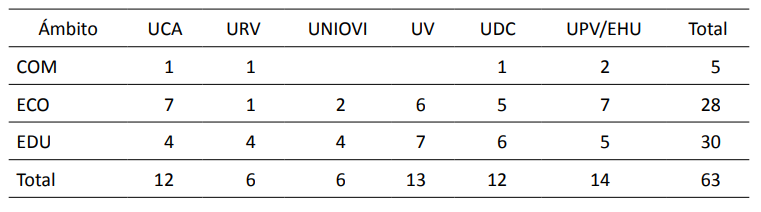
The qualitative phase (content validation) involved 22 members of the research teams from the six universities taking part in the project. Once the self-report had been validated, in the quantitative phase, all teachers who gave classes on Social Sciences masters courses from the six universities were invited by means of an email which provided the link to fill in the self-report. The coordinator of each master’s degree sent out this invitation to the teachers by email. Each teacher received the mail because they were teaching a subject on a specific master’s degree course. Their answers should always refer to that subject and not to other subjects that they might teach on other courses. A total of 626 teachers began the process to fill in the report, and 416 completed self-reports were finally obtained from the teachers on 63 master’s degrees (Table 2), of which 47.6% were in the field of education (EDU), 44.4% in economics and business studies (ECO) and 7.9% in communication (COM).
Distribution of the mater’s degree by university and field of knowledge
Demographic characteristics
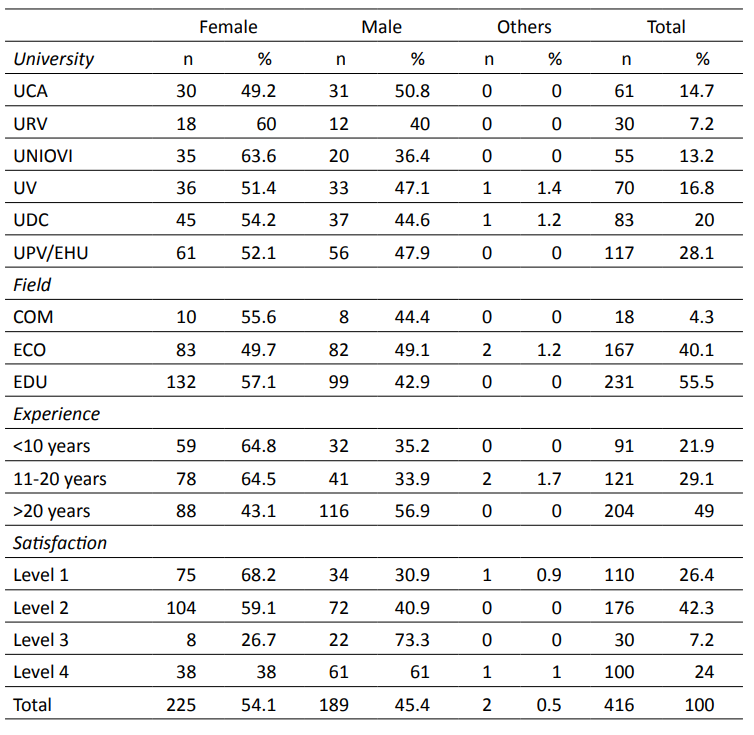
Table 3 presents the distribution of the 416 teachers by their university of origin, gender, field of knowledge in which they give classes (communication (COM), economics and business studies (ECO) and education (EDU)), years of experience, and degree of satisfaction and security with the assessment. Construction of the satisfaction and security levels considered the perceptions of the actual teachers in their answers to items 48 and 49 on the questionnaire and, based on these scores, four levels were determined according to the quartiles.
Data analysiss
To answer the first question, an exploration was performed using boxplots and descriptive statistics on central trend and dispersion. Secondly, to analyse the differences between groups (second question), non-parametric tests were performed as these were ordinal measurements that did not fit normality (K-S test, p<.001). Figure 2 presents the top-down process that was followed in the comparative analysis, using the Permutational Multivariate Analysis of Variance (PERMANOVA) for this at three different times. This multivariate analysis technique (on distance measurements) with several factors applies the analysis of permutations on the distance matrices ( Anderson, 2017) to determine the multivariate comparison. Firstly, the possible differences between groups were contrasted by comparing the four global dimensions (PERMANOVA I). To look in greater depth at the possible differences, an individual comparison is carried out concerning the items making up each dimension (PERMANOVA II) and, lastly, to understand the relationships between the variables, a final multi-variate analysis was carried out with all items at the same time (PERMANOVA III). Finally, each item was analysed individually using the Kruskal-Wallis H test. JASP (JASP Team, 2022) and R (R Core Team, 2021) were used to run these analyses.
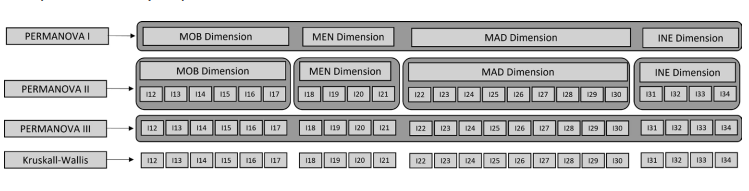
Figure 2
Comparative analysis process
RESULTS
Assessment methods and instruments used
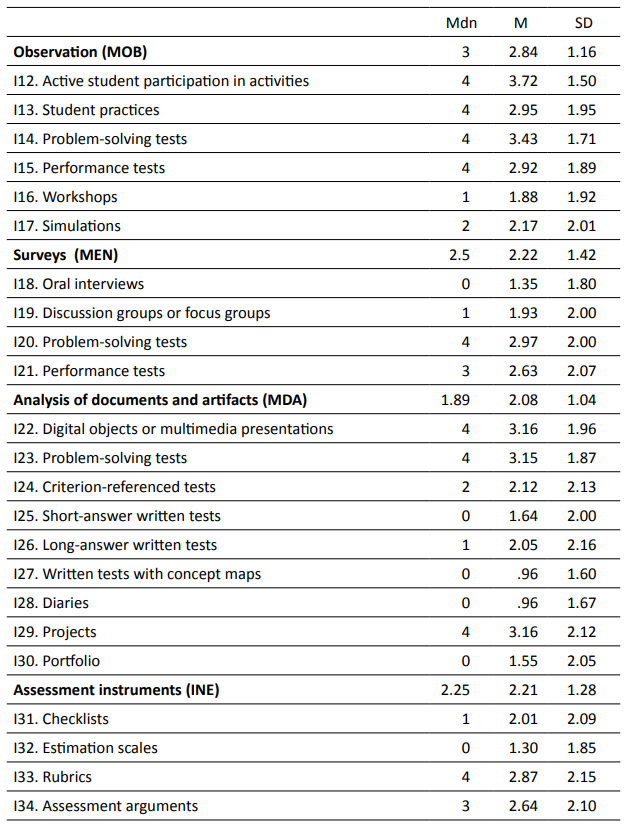
In answer to the first question in this study, Figure 3 shows the central trend (median), dispersion (inter-quartile range) and asymmetry of the scores in each of the four dimensions. Table 4 presents the measurements for central trend and dispersion by dimensions and items. The greatest degree of agreement or frequency occurs in the dimension of the observation methods (M=2.84) and at a lower level there are the dimensions for the surveying methods (M=2.22) and documents and artifacts (M=2.08). The assessment instruments score M=2.21.
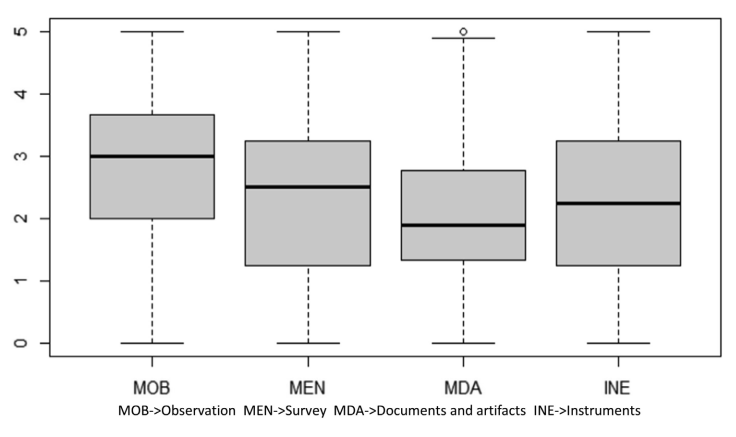
Figure 3
Boxplots corresponding to the RAPEVA self-report dimensions
Measurements for central trend and dispersion in each item
Methods used in the observation (MOB)
Observation is used to assess the students’ products or actions in some of the activities that they carry out (Table 4 and Figure 4). Consequently, as one example, 68% of the teachers mention that they use observation to check active participation from students compared to 11.6% that never or almost never use it. Observation is also used to analyse the problem-solving tests (61.5%), student practices (51.5%) and performance tests (52.2%). However, it is used much less in the simulations (33.4%) and workshops (27.9%).
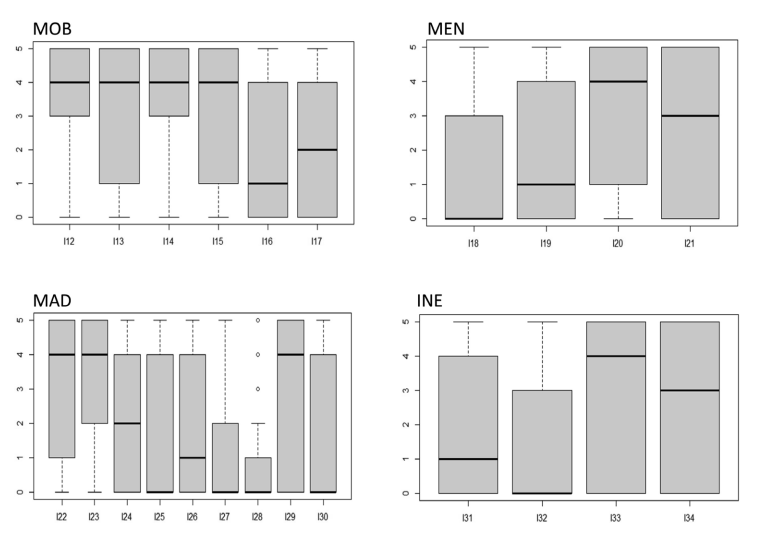
Figure 4
Boxplots for the items in the MOB, MEN, MAD and INE dimensions
Methods used in the surveys (MEN)
In this case, the answers were uneven. The average use of problem-solving tests has been checked, given that 54.8% of teachers state that they use them compared to almost 30% who never or almost never use them. In the same way, the performance tests are used by 47.9% although the discussion groups or focus groups are less usual alongside oral interviews given that they are usually only used by 31% and 19.2% respectively.
Methods used to analyse documents and artifacts (MAD)
Unequal use is seen in this category (Table 4 and Figure 4). The teachers demonstrate an average use of projects (60.1%), digital objects or multimedia presentations (57.9%) and problem-solving tests (56.5%). There is a more limited use of criterion-referenced tests (36.3%) and long-answer written tests (35.9%). There is even lower use of written tests with short answers (26.5%) and the portfolio (26.2%). Finally, there is an almost residual use of diaries (13.5%) and written tests using concept maps (12.3%).
Assessment instruments (INE)
Table 4 and Figure 4 demonstrate an average use of rubrics (53.3%) and evaluative arguments (49%). The use of the checklists (34.8%) and estimation scales (20.4%) is low.
Differences in the use of assessment methods and instruments
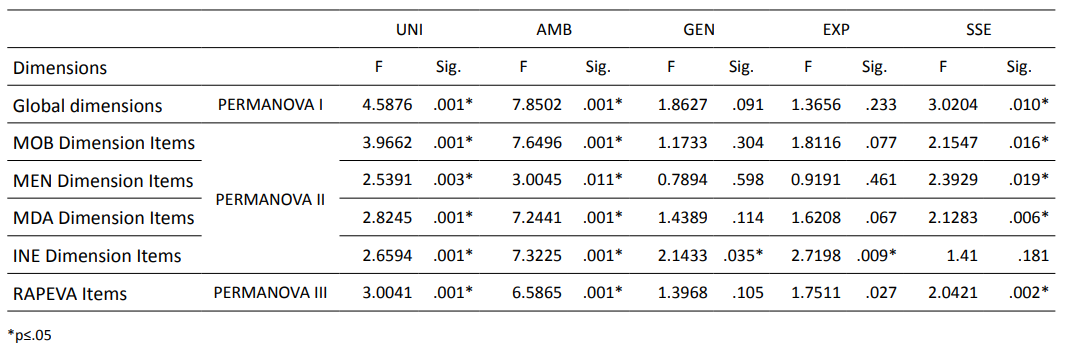
Regarding the second question raised in this study, Table 5 presents the results obtained from the PERMANOVA analyses. As the four dimensions are dependent variables (PERMANOVA I), significant differences were found according to the university (F5, 415=4.59, p=.001), field of knowledge (F2, 415=7.85, p=.001) and security and satisfaction with the assessment (F 3, 415=3.02, p=.010), and no differences were found due to gender (F2, 415=1.86, p=.091) or teaching experience (F2, 415=1.37, p=.233).
By considering the items in each of the four dimensions as dependent variables (PERMANOVA II), significant differences were found according to the university and field of knowledge. Depending on the gender and the teaching experience, significant differences were found when considering the items in the assessment instrument dimension.
PERMANOVA III considered the 23 items as independent variables and, in this case, the differences depended on the university (p=.001), the field of knowledge (p=.001), the teaching experience (p=.027) and the security and satisfaction (p=.002).
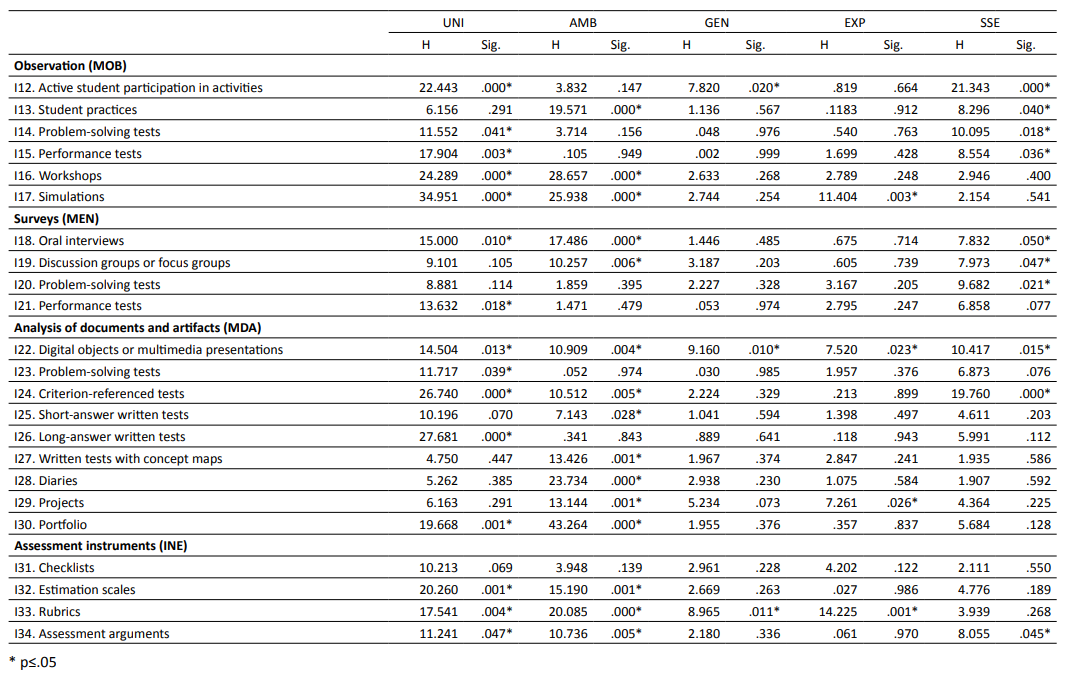
Finally, the Kruskall-Wallis H test was performed to analyse each of the items independently (Table 6).
PERMANOVA results depending on the university (UNI), field of knowledge (AMB), gender (GEN), experience (EXP) and satisfaction (SSE)
Results from the Kruskall Wallis H-test depending on the university (UNI), the field of knowledge (AM), gender (GEN), experience (EXP) and assessment satisfaction (SSE)
Differences according to the university
Significant differences have been found (p≤.05) in 15 out of the 23 items. The observation demonstrates differences in all assessment methods, except in observation of the practices. In this respect, although it is difficult to discern action guidelines from the different universities, after comparative analysis, the UPV/EHU generally demonstrates lower use in almost all cases. The URV (M=4.37) and the UCA (M=4.26) stand out in the observation of the students’ active participation. The UCA (M=3.72), along with the UDC (M=3.64) and UV (M=3.63), also stand out in the observation on problem solving. In the performance tests, the scores for UDC (M=3.40), UV (M=3.21), UNIOVI (M=3.02) and UCA (M=2.98) are higher than for
the UPV/EHU (M=2.55) and URV (M=2.07). In the observation on the workshops, although the scores are generally low, the UDC (M=2.64) stands out over the other universities. Finally, in the observation of the simulations, there are also significant differences between the UV (M=3.14) and the UPV/EHU (M=1.56).
These differences between universities can also be seen in the use of oral interviews and the performance tests. In both cases, the teachers from the UPV/ EHU (M=0.97) and the URV (M=0.63) demonstrate less use than the teachers from the other universities.
It can also be seen in the comparative analysis that the teachers from the UPV/EHU (M=2.65) demonstrate less use of digital objects or multimedia presentations than the other universities. The criterion-referenced tests are most used by teachers from the UDC (M=2.76) and the UCA (M=2.48), while they are barely used in the UPV/EHU (M=1.79) and in the URV (M=0.67). On the contrary, long-answer written tests are most used in the UV (M=2.99) and barely used in the URV (M=0.67). Although use of the portfolio is not particularly widespread in general, teachers from the UPV/EHU (M=1.11) and the URV (M=0.70) express the least use.
Differences depending on the field of knowledge
Significant differences were also detected in 15 items. In the observation dimension, these are demonstrated in three of the assessment measurements. Both in the use of student practices (M=3.61) and in the workshops (M=3.33), it is the communication teachers who express greater use compared to education teachers (M=3.30; M=2.14) and particularly compared to economics teachers (M=2.40; M=1.37). Regarding the observation of simulations, there are also significant differences between communication (M=2.56) and education (M=2.57) compared to economics (M=1.56).
In the surveys, there are differences in two of the four methods within this dimension. In the case of the oral interviews, although in general they are barely used (M=1.35), it is the economics and business studies teachers (M=0.96) that demonstrate the least use. Significant differences have also been found in the use of discussion groups or focus groups, where it is the communication teachers (M=2.50) who express the greatest use, compared to teachers from education (M=2.13) and economics and business studies (M=1.59).
In the use of digital objects or multimedia presentations, differences can be found between the education (M=3.45) and communication (M=3.33) teachers compared to economics and business studies teachers (M=2.74). However, in the use of the criterion-referenced tests, the situation is reversed, and it is the economics and business studies teachers (M=2.53) who demonstrate greater use than in communication (M=2.22) or education (M=1.81). Something similar happens with the use of written tests with short-answer questions given that the score from economics and business studies is the highest (M=2.02) followed by education (M=1.38) and communication (M=1.33). Written tests with concept maps are not particularly widely used, although in this case, use is greater in communication (M=2.00) than in education (M=1.09) and in economics and business studies (M=0.68). Diaries are also barely used and as in the previous case, there is a greater use in communication (M=2.06) than in education (M=1.19) and in economics and business studies (M=0.53). Project assessment is generally more widespread, and the differences lie between communication (M=4.00), and education (M=3.42) and economics and business studies (M=2.70). Finally, use of the portfolio is not particularly widespread (M=1.55), although greater use is expressed by teachers from education (M=2.10) compared to communication (M=1.89) and economics and business studies (M=0.76).
When analysing the differences between the instruments, there is greater use of estimation scales by teachers of communication (M=1.78) and education (M=1.56) compared to economics and business studies (M=0.89). There is stand-out use of rubrics by teachers of education (M=3.56) compared to economics and business studies (M=2.31) and communication (M=1.78). Greater use of the evaluative argument is demonstrated by communication (M=3.17) and education (M=2.90) teachers compared to economics and business studies (M=2.23).
Differences depending on the security and satisfaction with the assessment
There are significant differences in 10 of the 23 items: in the observation in four of the six methods considered; in the surveys in three of the four methods and finally, in two of the nine methods where document and artifact analysis were used. In the assessment instruments, differences were only found in the use of evaluative arguments.
When comparing all four levels, the level-4 teachers (greater assessment security) expressed a greater degree of use compared to the other levels in observation of active participation and student practices, problem-solving tests or performance tests.
In the case of the oral interviews, level-4 teachers (M=1.77) express greater use than teachers from level 1 (M=1.06), level 2 (M=1.35) or level 3 (M=0.97). The use of the discussion groups or focus groups is also more widely spread among level-4 teachers (M=2.24) than level 1 (M=1.67). A greater use of problem-solving tests is expressed by teachers in levels 3 (M=3.43) and 4 (M=3.30) compared to levels 2 (M=2.88) and 1 (M=2.70).
Concerning the use of digital objects or multimedia presentation, once again teachers with greater assessment security (level 4) express greater diligence in their use (M=3.36) than in level 1 (M=2.84). In the same way, level-4 teachers make greater use of criterion-referenced tests (M=2.84) than the other levels.
Finally, in the assessment instruments, significant differences only appeared in the use of the evaluative argument. In addition, this time, level-4 teachers express a greater degree of use (M=3.04) than the rest of the teachers from level 1 (M=2.49), level 2 (M=2.54) or level 3 (M=2.47).
Differences according to gender and teaching experience
Based on gender, differences have only been found in the use of two assessment methods and one of the instruments. In the observation on student participation, the women express a greater degree of use (M=3.91) than the men (M=3.51) or the ‘others’ collective (M=2.00). In the same way, women demonstrate a greater use (M=3.42) of analysis of digital objects or multimedia presentation compared to men (M=2.84) and ‘others’ (M=3.00). Finally, rubrics are used to a greater extent by women (M=3.13) compared to men (M=2.58) or null use by ‘others’.
In reference to teaching experience, differences have only been found in use of three of the assessment methods presented (simulations, digital objects or multimedia presentations and projects) and in the use of rubrics. Practically, in these four cases, as the years of experience increase, the score in those items drops. For instance, in the case of the rubrics, the newest teachers (M=3.54) demonstrate that they use them in a greater proportion than teachers with between 11 and 20 years of experience (M=2.93) and particularly compared to the most experienced teachers (M=2.51).
DISCUSSION AND CONCLUSIONS
This study aims to, firstly, verify the assessment methods and instruments used in Social Science master’s degrees. Secondly, it intends to analyse any differences depending on certain contextual and personal variables. The third research question focusses on whether any changes can be perceived in the use of assessment methods and instruments.
As demonstrated, the validity, relevance and adequacy of the methods and instruments used in the assessment will enable fair and well-founded inferences on the students’ progress (Sadler, 2016). Prior studies have shown that, on degree courses in various Spanish universities, although there has been a slight change, the final exam still prevails as the method of assessment. This has been corroborated both in studies which analysed the subject teaching guides (Ibarra-Sáiz & Rodríguez-Gómez, 2010; Rodríguez-Gómez et al., 2013; Panadero et al., 2019) and in studies based on student feedback (Lukas et al., 2011; Lukas et al., 2016).
Other studies demonstrate the relationship between the quality of the assessment and the skills developed by the students (Ibarra-Sáiz et al., 2020a) and, as Boud (2020) indicates, the use of inappropriate assessment methods can lead to deficient learning, so we must use methods that produce high-level learning among students. In this respect, the results show some differences in the assessment methods and instruments compared to prior degree studies. It has thereby been shown that the teachers use the observation to analyse participation, problem solving, student practices or performance tests. There is much less use of analysis of simulations and workshops, which are unusual in Social Sciences.
In general, surveys are used less by the teachers. They are slightly more used in problem-solving or performance tests and barely used in the focus groups or oral interviews.
Regarding analysis of documents and artifacts, this mainly involves analysis of digital objects or multimedia presentations, project analysis or problem-solving tests. One third of the teachers state that they use criterion-referenced tests, short- answer written tests or long-answer written tests. This differs considerably from degree courses as demonstrated in prior studies. There is an almost residual use of the portfolio, diaries and written tests using concept maps.
Finally, the assessment instruments most used by the teachers are the evaluative argument and, above all, rubrics which have been more widely used over the last few years and which are used by more than half the teachers. The checklists and the estimation scales still have low use.
The differences highlighted over former studies might be due to a variety of reasons. One of them might be the number of students that is very different in degree studies (much higher usually) compared to master’s degrees (much less in general). Another cause might be the proximity of the master’s degrees to students’ future careers, requiring teachers to use assessment methods that are closer to real assessments. In other words, they offer the use of assessment tasks and processes which represent the types of tasks and processes that might be found in professional practice. These results corroborate findings in Boud (2020) who states that there has been a change from using classic tests or final exams focussed on reproducing knowledge towards a set of assessment methods used to integrate and give coherence to the learning. The results, although far from an ideal situation, represent a slight change in the diversity of the assessment methods and instruments given that they are slowly putting the spotlight on the student’s performance, what they produce and do, encouraging critical thinking and creativity (Boud, 2020) and this opens the door to improving designs for assessment tasks (Ibarra-Sáiz et al., 2021) with higher quality levels.
The third question in the study checked whether it might be possible to associate certain differences in the use of assessment methods and instruments with determined contextual variables. In this respect, the results demonstrate that the most significant differences were found in the university and the field of knowledge variables. In both cases, these differences occurred in 65% of the items under analysis. A third differentiating element comprises the level of satisfaction and security among the teachers regarding the assessment system that they use, as differences are seen between the different levels in 48% of the items. Differences based on professional experience are demonstrated in 17% of the items, and in 13% in the case of gender. This demonstrates the relevance of the policies for developing teaching professionals at a university level and the need to focus them from a systematic and integral framework (Malagón Terrón & Graell Martín, 2022). In addition, coinciding with the paper by Llorent et al. (2020), it is necessary to consider the differences in the teaching culture constructed from the teachers’ field of knowledge to substantiate changes in the evaluative practices that fit its immediate contexts and which are based on the necessary critical thinking attitude.
One limitation of this study lies in the sample producing the data as it was not selected at random, and it encompasses six public universities. However, it should initially be explained that the participating universities belong to different regions with independent quality agencies; furthermore, the demographic characteristics of the participating teachers present enough heterogeneity to sufficiently maintain the sample representiveness.
Future research could broaden the sample to public and private universities, to other branches of knowledge and degree courses, which would make it possible to generalise the results. In any case, there is a clear need for studies that go into greater depth not only in the type of assessment methods and instruments that the teachers use in their evaluative practice but, above all, the edumetric characteristics (Dochy, 2009) of these methods and instruments and how they are used by teachers and students, in as much as they are elements that modulate the students’ learning. From this perspective, it would be a good idea to analyse these assessment methods and instruments using edumetric criteria on cognitive complexity, authenticity of the tasks, fairness and justice, transparency of the assessment procedures and the influence of assessment in education, which means analysing the validity of the assessment tasks, the validity of the scores in the performance assessments, the generalisability of the assessment and its consequent validity. This line of research could be focussed methodologically from a qualitative perspective, by means of case studies that look more deeply at comprehension of the assessment practice in higher education, and the contributions and characteristics of the evaluative focus of the assessment as learning should be taken as a conceptual reference framework (Boud, 2022; Yan & Boud, 2022).
This study has demonstrated how university teachers perceive their evaluative practice, by considering the diversity of assessment methods and instruments that they use. Furthermore, the RAPEVA self-report will make it easier to adapt or replicate this study in other collectives which have been suggested as possible future lines of research.
The differences found, concerning the university of origin, the field of knowledge where they are working or their satisfaction with the assessment system, raise the need for critical review and the boost from training and professional development policies for teachers in general, and specifically on the aforementioned assessment focus points. Only as the universities bring about greater professional development and critical training processes, upheld in the progress of the knowledge achieved on assessment in higher education in the last few decades (Ibarra-Sáiz et al., 2020b), can methods and instruments be incorporated into the evaluative practice which might favour and strengthen the students’ high level learning.
Acknowledgments
This work was made possible by the FLOASS Project – Resultados y analíticas de aprendizaje en la educación superior: Un marco de acción desde la educación sostenible, (Results and analysis of learning in higher education: an action framework working from sustainable education) funded by the Ministry of Science, Innovation and Universities in the Spanish R+D+i Programme on Challenges for Society and the European Regional Development Fund (Ref. RTI2018-093630-B100), and support from the UNESCO Chair on Evaluation, Innovation and Excellence in Education at the University of Cádiz.
REFERENCES
Anderson, M. J. (2017). Permutational Multivariate Analysis of Variance (PERMANOVA). Wiley StatsRef: Statistics Reference Online, 1–15. https://doi.org/10.1002/9781118445112.stat07841
Biggs, J. (2015). Assessment in a constructively system. International Conference Assessment for Learning in Higher Education 2015.
Biggs, J., & Tang, C. (2011). Teaching for quality learning at university. What the students does (4th ed.). McGraw-Hill-SRHE & Open University Press.
Boud, D. (2020). Challenges in reforming higher education assessment: a perspective from afar. RELIEVE, 26(1), art. M3. https://doi.org/10.7203/relieve.26.1.17088
Boud, D. (2022). Assessment-as-learning for the development of students’ evaluative judgement. In Assessment as Learning. Maximising Opportunities for Student Learning and Achievement (pp. 25–37). Routledge.
Brown, S., & Pickford, R. (2013). Evaluación de habilidades y competencias en Educación Superior. Narcea.
Creswell, J. W. (2015). A Concise Introduction to Mixed Methods Research. SAGE Publications.
Dochy, F. (2009). The Edumetric Quality of New Modes of Assessment: Some Issues and Prospect. In G. Joughin (Ed.), Assessment, Learning and Judgement in Higher Education (pp. 85–114). Springer Science & Business Media B.V.
European Centre for Development of Vocational Training. (2014). Terminology of European education and training policy. A selection of 130 key terms. Publications Office of the European Union.
Hair, J. F., Hult, G. T. M., Ringle, C. M., & Sarstedt, M. (2022). A Primer on Partial Least Squares Structural Equation Modeling (PLS-SEM) (3rd ed.). SAGE Publications.
Henseler, J. (2021). Composite-Based Structural Equation Modeling. Analyzing Latent and Emergent Variables. Guilford Press.
Hwang, H., & Takane, Y. (2015). Generalized Structured Component Analysis: A Component-Based Approach to Structural Equation Modeling. CRC Press.
Ibarra-Sáiz, M.S., & Rodríguez-Gómez, G. (2019, 19-21 junio). FLOASS - Learning Outcomes and Learning Analytics in Higher Education: An Action Framework from Sustainable Assessment. [Póster]. XIX Congreso Internacional de Investigación Educativa. Investigación comprometida para la transformación social, Madrid.
Ibarra-Sáiz, M.S., & Rodríguez-Gómez, G. (2010). Aproximación al discurso dominante sobre la evaluación del aprendizaje en la universidad. Revista de Educación, (351), 385–407.
Ibarra Saiz, M. S., & Rodríguez Gómez, G. (2014). Modalidades participativas de evaluación: Un análisis de la percepción del profesorado y de los estudiantes universitarios. Revista de Investigación Educativa, 32(2), 339-361. https://dx.doi.org/10.6018/rie.32.2.172941
Ibarra-Sáiz, M.S., & Rodríguez-Gómez, G. (2020). Evaluating Assessment. Validation with PLS-SEM of ATAE Scale for the Analysis of Assessment Tasks. RELIEVE, 26(1), art. M4. https://doi.org/10.7203/relieve.26.1.17403
Ibarra-Sáiz, M.S., & Rodríguez-Gómez, G., & Boud, D. (2020a). Developing student competence through peer assessment: the role of feedback, self-regulation and evaluative judgement. Higher Education, 80(1), 137–156. https://doi.org/10.1007/s10734-019-00469-2
Ibarra-Sáiz, M.S., & Rodríguez-Gómez, G., Boud, D., Rotsaert, T., Brown, S., Salinas Salazar, M. L., & Rodríguez Gómez, H. M. (2020b). The Future of Assessment in Higher Education. RELIEVE, 26(1), art. M1. https://doi.org/10.7203/relieve.26.1.17323
Ibarra-Sáiz, M.S., Rodríguez-Gómez, G., & Boud, D. (2021). The quality of assessment tasks as a determinant of learning. Assessment & Evaluation in Higher Education, 46(6), 943–955. https://doi.org/10.1080/02602938.2020.1828268
JASP Team. (2022). JASP (Version 0.16.1). https://jasp-stats.org/
Johnson, R. L., & Morgan, G. B. (2016). Survey scales. A guide to development, analysis, and reporting. The Guilford Press.
Lukas, J. F., Santiago, K., & Murua, H (2011). Unibertsitateko ikasleen ikaskuntzara bideratutako ebaluazioa. Tantak, 23(1), 77-97.
Lukas, J.F., Santiago, K., Lizasoain, L. & Etxeberria, J. (2017). Percepciones del alumnado universitario sobre la evaluación. Bordón. 69(1), 103-122. https://doi.org/10.13042/Bordon.2016.43843
Mateo Andrés, J. y Martínez Olmo, F. (2008). La evaluación alternativa de los aprendizajes. Octaedro.
Panadero, E., Fraile, J., Fernández Ruiz, J., Castilla-Estévez, D., & Ruiz, M. A. (2019). Spanish university assessment practices: examination tradition with diversity by faculty. Assessment & Evaluation in Higher Education, 44(3), 379–397. https://doi.org/10.1080/02602938.2018.1512553
R Core Team. (2021). R: A language and environment for statistical computing. R Foundation for Statistical Computing. https://www.r-project.org/
Rodríguez-Gómez, G., & Ibarra-Sáiz, M. S. (Eds.). (2011). e-Evaluación orientada al e-Aprendizaje estratégico en Educación Superior. Narcea.
Rodríguez-Gómez, G., Ibarra-Sáiz, M. S., & García-Jiménez, E. (2013). Autoevaluación, evaluación entre iguales y coevaluación: conceptualización y práctica en las universidades españolas. Revista de Investigacion en Educación, 11(2), 198–210.
Sadler, D.R. (2016). Three in-course assessment reforms to improve higher education learning outcomes. Assessment & Evaluation in Higher Education, 41(7), 1081–1099. https://doi.org/10.1080/02602938.2015.1064858
Yan, Z., & Boud, D. (2022). Conceptualising assessment-as-learning. In Z. Yan & L. Yang (Eds.), Assessment as Learning. Maximising Opportunities for Student Learning and Achievement(pp. 11–24). Routledge.
Received: 14 March 2022
Accepted: 13 September 2022
Published: 02 January 2023